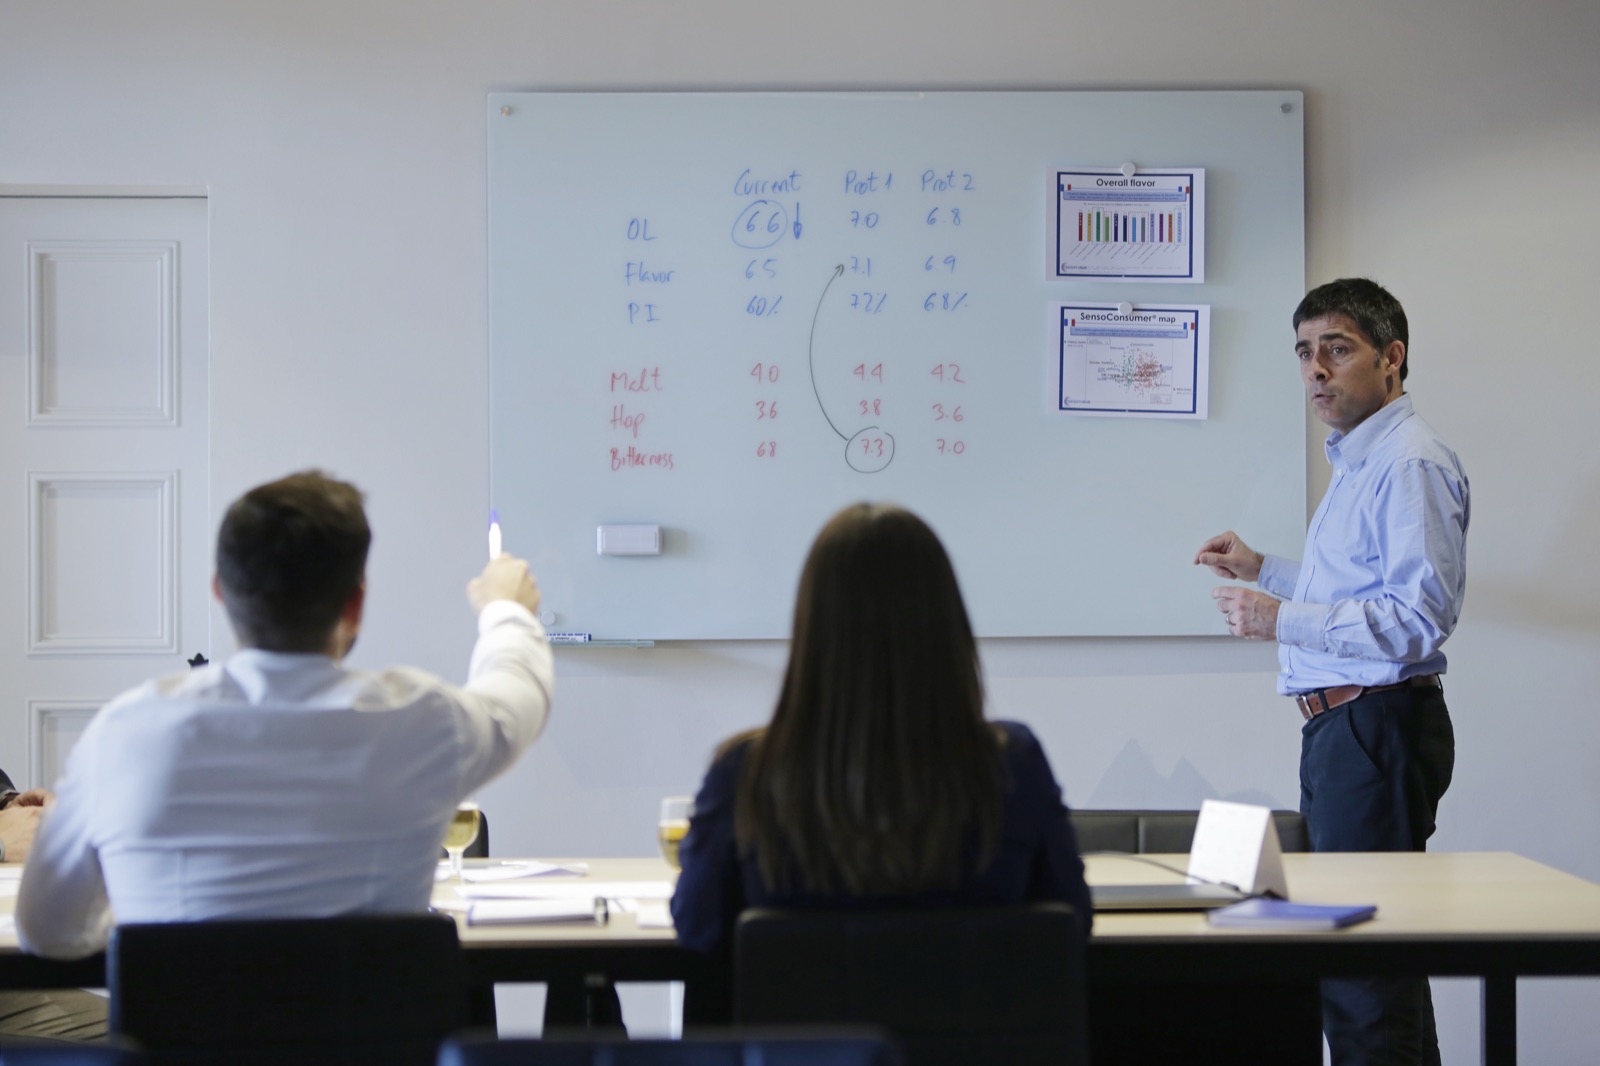
A reformulation that cannot afford to lose the loyal consumer, a competitor that has undercut you, a prototype that has to be defended to the committee. This is the axis that turns what has been measured into the decision, and into the case that supports it.
We have worked for one industry only — food and beverage — since 2000.
Results presentation · attribute table
Measuring is not deciding
The panel describes the product attribute by attribute. Consumers say how much they like it, and who does. Neither measurement, on its own, tells you which attribute to defend when a competitor arrives, how far an ingredient can be cut, or which of three prototypes is worth the cost of making.
Crossing the two on the same samples is what brings out what moves preference, and that comparison is set out in full in Preference mapping. What starts here is what you do with the result: decide, and leave the decision defensible in front of whoever has to approve it.
An off-the-shelf method does not reach that far. What works in one company does not necessarily work in another, even when both are in this industry.
Where a project comes in
The four run in order, though almost no project runs through all of them: most start at one door and end up touching two or three.
The four lines are not a catalogue: there are six projects told from start to finish, each with the decision that was on the table.
Clients are not named, because every project runs under a confidentiality agreement, and the figures are as each company reported them.
What never changes in a project
Two things repeat project after project, and both come from having worked for a single industry.
Food and beverage only
We work for these markets and no others, and the team comes from inside them: senior roles in marketing and in R&D at food companies. It changes the first meeting, because nobody has to explain the category, and it changes the recommendation, which is written for whoever will have to defend it.
The company’s story and who signs each recommendation are in Who we are.
Everything we measure is quantitative: consumer product tests and sensory analysis, with statistics deciding which differences are real. The report is built to support a decision — optimise, launch or reformulate — and the recommendations are written so that R&D and marketing can carry them out.
Two steps in the working cycle take almost everyone by surprise: the counter-briefing, which challenges the question before anything is measured, and the second product tasting, which keeps the recommendation from resting on a table of numbers alone.
Tell us what has to be decided and what you already have measured. We will tell you what it would take to support the decision, and where the project would come in.